In today’s digital age, consumers are more informed and conscientious than ever before. With the abundance of news and information readily available, their purchasing decisions are often influenced by the latest trends and buzzwords.
This is particularly true when it comes to packaged food and beverages, where conscious consumers are constantly seeking healthier alternatives. In this blog post, we’ll explore why CPG food brands need to be mindful of trends, like alternative sweeteners, that consumers hear in the news and how to use this information to a brand’s advantage.
The Power Of Consumer Awareness
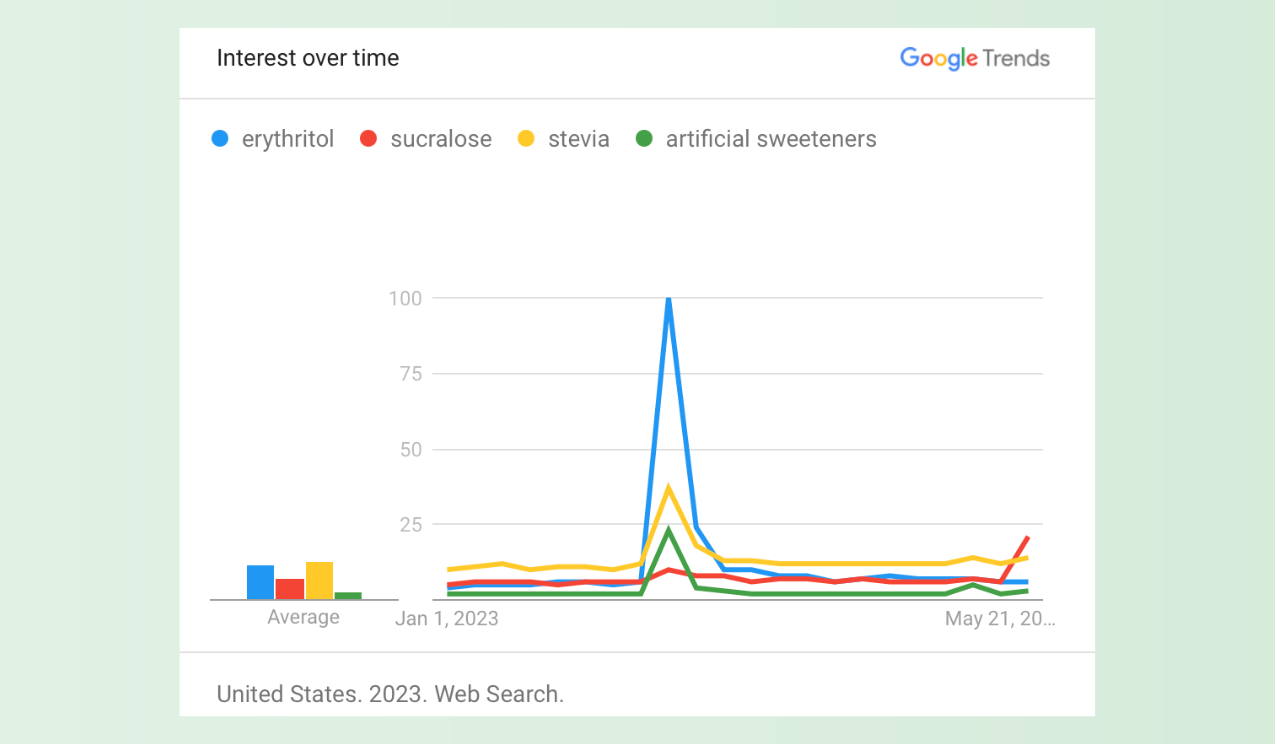
In February of this year, a study found erythritol, a sugar substitute popular in low-calorie, low-carbohydrate, and keto-friendly products, was linked to a higher risk of heart attack, stroke, and death. More recently, a study found that a chemical compound in sucralose, the popular sweetener in products like Splenda, is genotoxic and potentially carcinogenic. In other words, this chemical harms a cell’s genetic information and may cause cancer.
When consumers hear news about studies like these it significantly impacts their preferences. As they become more aware of the need for healthier options, their Google searches and online grocery shopping behaviors reflect this newfound awareness.
This shift in consumer behavior presents an opportunity for CPG food brands to align their product formulation, data, and attribution with emerging trends and cater to the evolving preferences of their target audience.
Your Sugar Content As A Differentiator
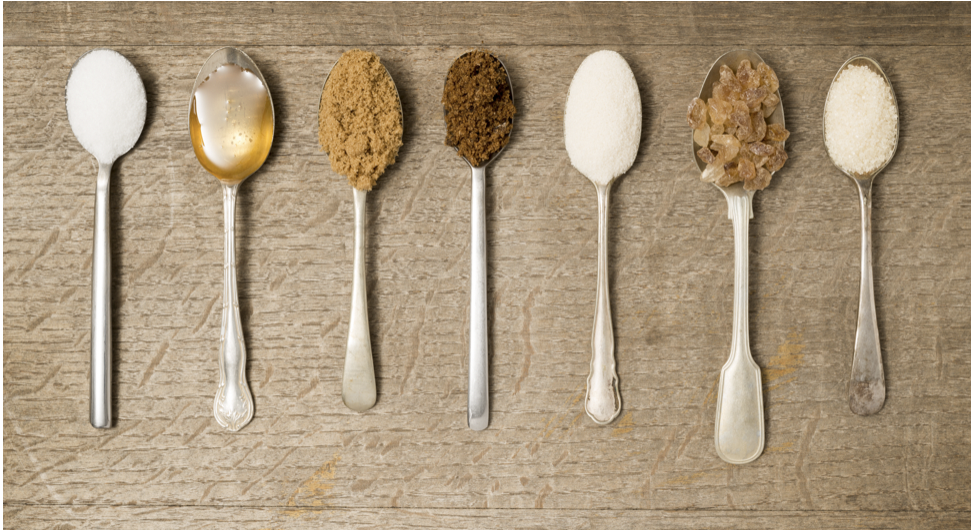
One of the overarching trends in the food industry is the consumer-driven movement toward reducing sugar intake. Health-conscious individuals increasingly seek products with lower sugar content or healthier sweetener alternatives. As a CPG food brand, being mindful of this consumer trend and popular ingredients within your category is crucial for capturing new customers and succeeding on the digital shelf.
In the crowded digital marketplace, it’s essential to have a unique selling point and clarity on how your product compares to top brands within your category. Your product’s sugar or sweetener content can be a powerful differentiator and is one opportunity to leverage your ingredient list to meet the latest trends.
Calling out your product’s low sugar content, or lack of erythritol and sucralose, are quick opportunities to capture new customers and drive sales. With these trends in mind, perform a category analysis to see how the type and amount of sweeteners your product uses compares with your competitors and top sellers.
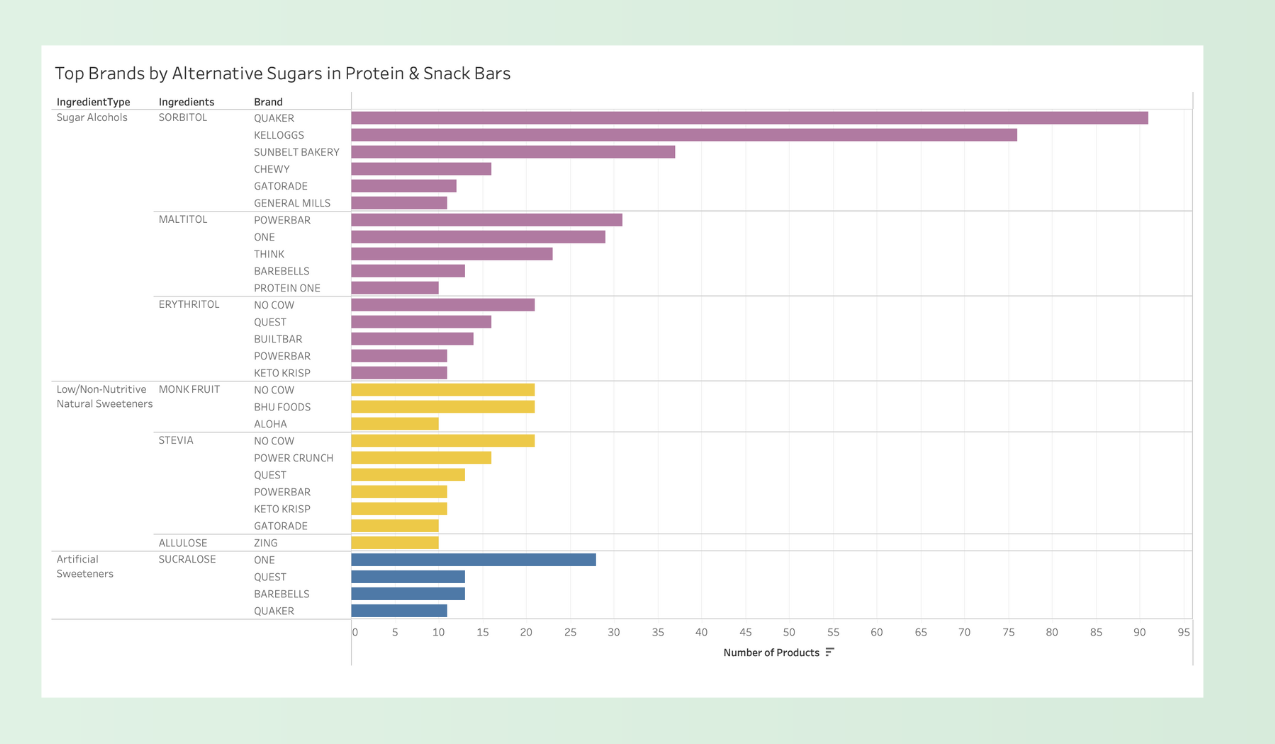
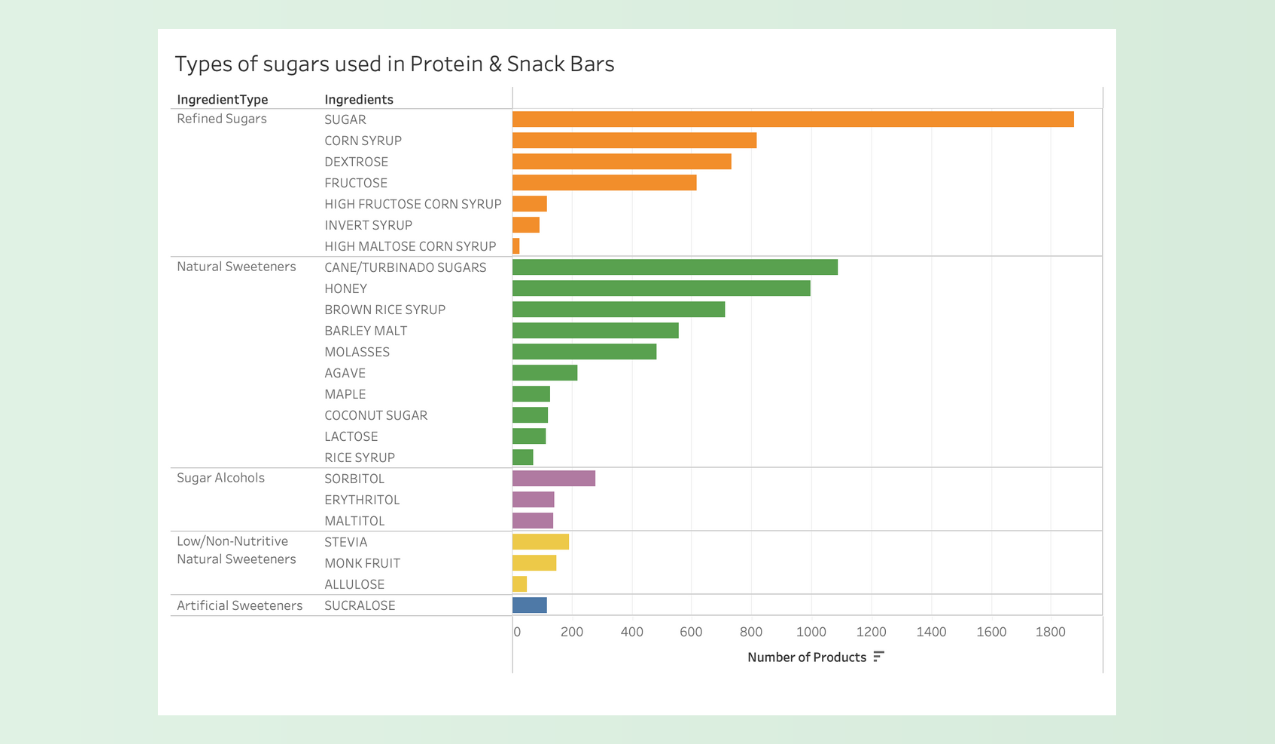
You’ll notice from the graph above that sugar alcohols, like sorbitol, maltitol, and erythritol, are a popular alternative sweetener choice for top snack bar brands. While the use of sugar alcohols as a sweetener may capture consumers seeking lower sugar or lower calorie products, they aren’t for everyone.
For some, sorbitol and maltitol can cause gastrointestinal side effects and are not compatible with a low FODMAP diet. While the research on sugar alcohols and gut health is evolving the attribute, “sugar alcohol-free” could act as a differentiator.
Taking advantage of consumer trends doesn’t require a new product formulation or redesigning your packaging. Instead, you can optimize your product data and back-end attributes on your e-commerce platforms so it’s easily discovered by consumers, even with their new shopping behaviors. Highlighting your product’s sugar content or type of sweetener can position you as a mindful and forward-thinking brand that understands and caters to consumer preferences.
Technology To Keep You On Trend
To effectively navigate the evolving landscape of consumer trends and make informed decisions, you need access to accurate and comprehensive data insights. This is where a trusted product data platform, like EatQ, comes in.
With data from over 3,600 snack bar brands, EatQ offers a wealth of category data insights for the increasingly popular snack bar category. For example, EatQ data shows the average serving size of a bar is 42 grams (1.5 ounces) and contains 10 grams of sugar.
The top 5 most popular sugars in protein and snack bars are sugar (refined), cane/turbinado (partially refined) sugars, honey, corn syrup, and dextrose. By understanding what is popular within your category, you can refine your marketing strategy, effectively pitch to retailers, and optimize your product listings for discovery by health-conscious consumers.
The Takeaway
Success lies in understanding your consumers and leveraging insights to provide them with the products they want. Utilize a trusted product data platform to stay ahead of the competition, understand your positioning, and capitalize on emerging trends.
Ready to take your CPG food brand to the next level?
Activate your free EatQ account today to unlock full access to our product and category data insights.
About EatQ
EatQ is a leading product data platform that specializes in helping small, health, and sustainability-focused brands differentiate themselves in online grocery retail. The EatQ platform provides affordable pre-sales planning, marketing, and research tools including Competitor Comparison and Claim Finder features.