Category Insight Report
Find out how to be a category leader
We help you find the opportunity and provide validation on what’s missing in the US market based on thousands of products.
Avoid being a me-too product and identify trending labels to put on pack, positioning opportunity, package sizes, and pricing.
Get your $899 category report with 20% off now for $719.
- A 30-page report with unique insights specific to your category.
- 3 months access to EatQ platform.
- Free consultation with a category analysis expert.

Here’s What You’ll Get
Our category insights are designed to provide clear, actionable insights into your category and identify white space and opportunities.

Identifying Market Leaders
Highlighting the top performers in innovation, ESG (Environmental, Social, and Governance) practices, health and nutrition, and free-from/clean product attributes.

Spotting Trends and Opportunities
Analyzing current market trends, consumer preferences, and emerging opportunities in the granola and muesli category.

Guiding Strategic Decisions
This report offers data-driven insights that are crucial in helping stakeholders, such as manufacturers, investors, and category buyers, make informed decisions regarding product development, market entry, and brand positioning.

Highlighting Attributes and Certifications
Examining prevalent and emerging product attributes and certifications that can help brands stand out in a competitive market.

Supporting ESG and Health Initiatives
Guiding how brands can enhance their ESG practices and health-oriented product offerings to meet consumer demands and regulatory standards.

Identifying White Space
This report is your guide to uncovering underexplored areas and potential gaps in the market. These are opportunities that you can leverage for growth and innovation, inspiring you to take your brand to new heights.
Report Details
Get answers to questions such as:
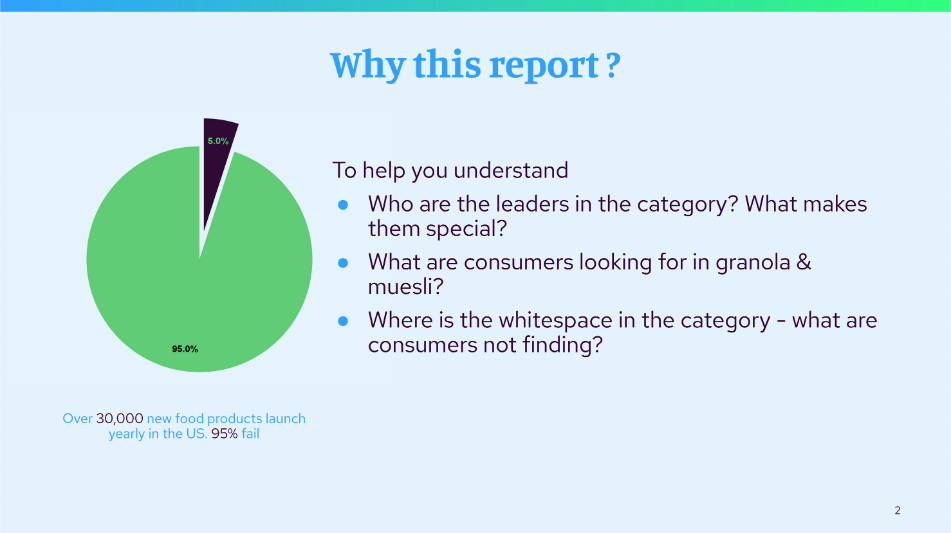
- Who are the leaders in Innovation, ESG, Free-from or Health&Nutrition? What makes them special?
- What are the most popular brands by velocity on Amazon? What makes them special?
- How many competitors and products are in the US landscape? What is changing?
- Where is the white space in the category (from flavor, attribute, and certification perspective)?
- What should I put on pack? What attributes and claims are increasing and decreasing?
- What are the popular flavors? Unique flavors? Flavor trends?
- What are common and unique ingredients?
- What are common package sizes? Which ones generate the most sales?
- What average selling prices? What do leaders sell at?
- What are the nutritional ranges? Where do the leaders sit?
Tanja
CEO & Founder BREADISTA
Get Access to EatQ Data Platform

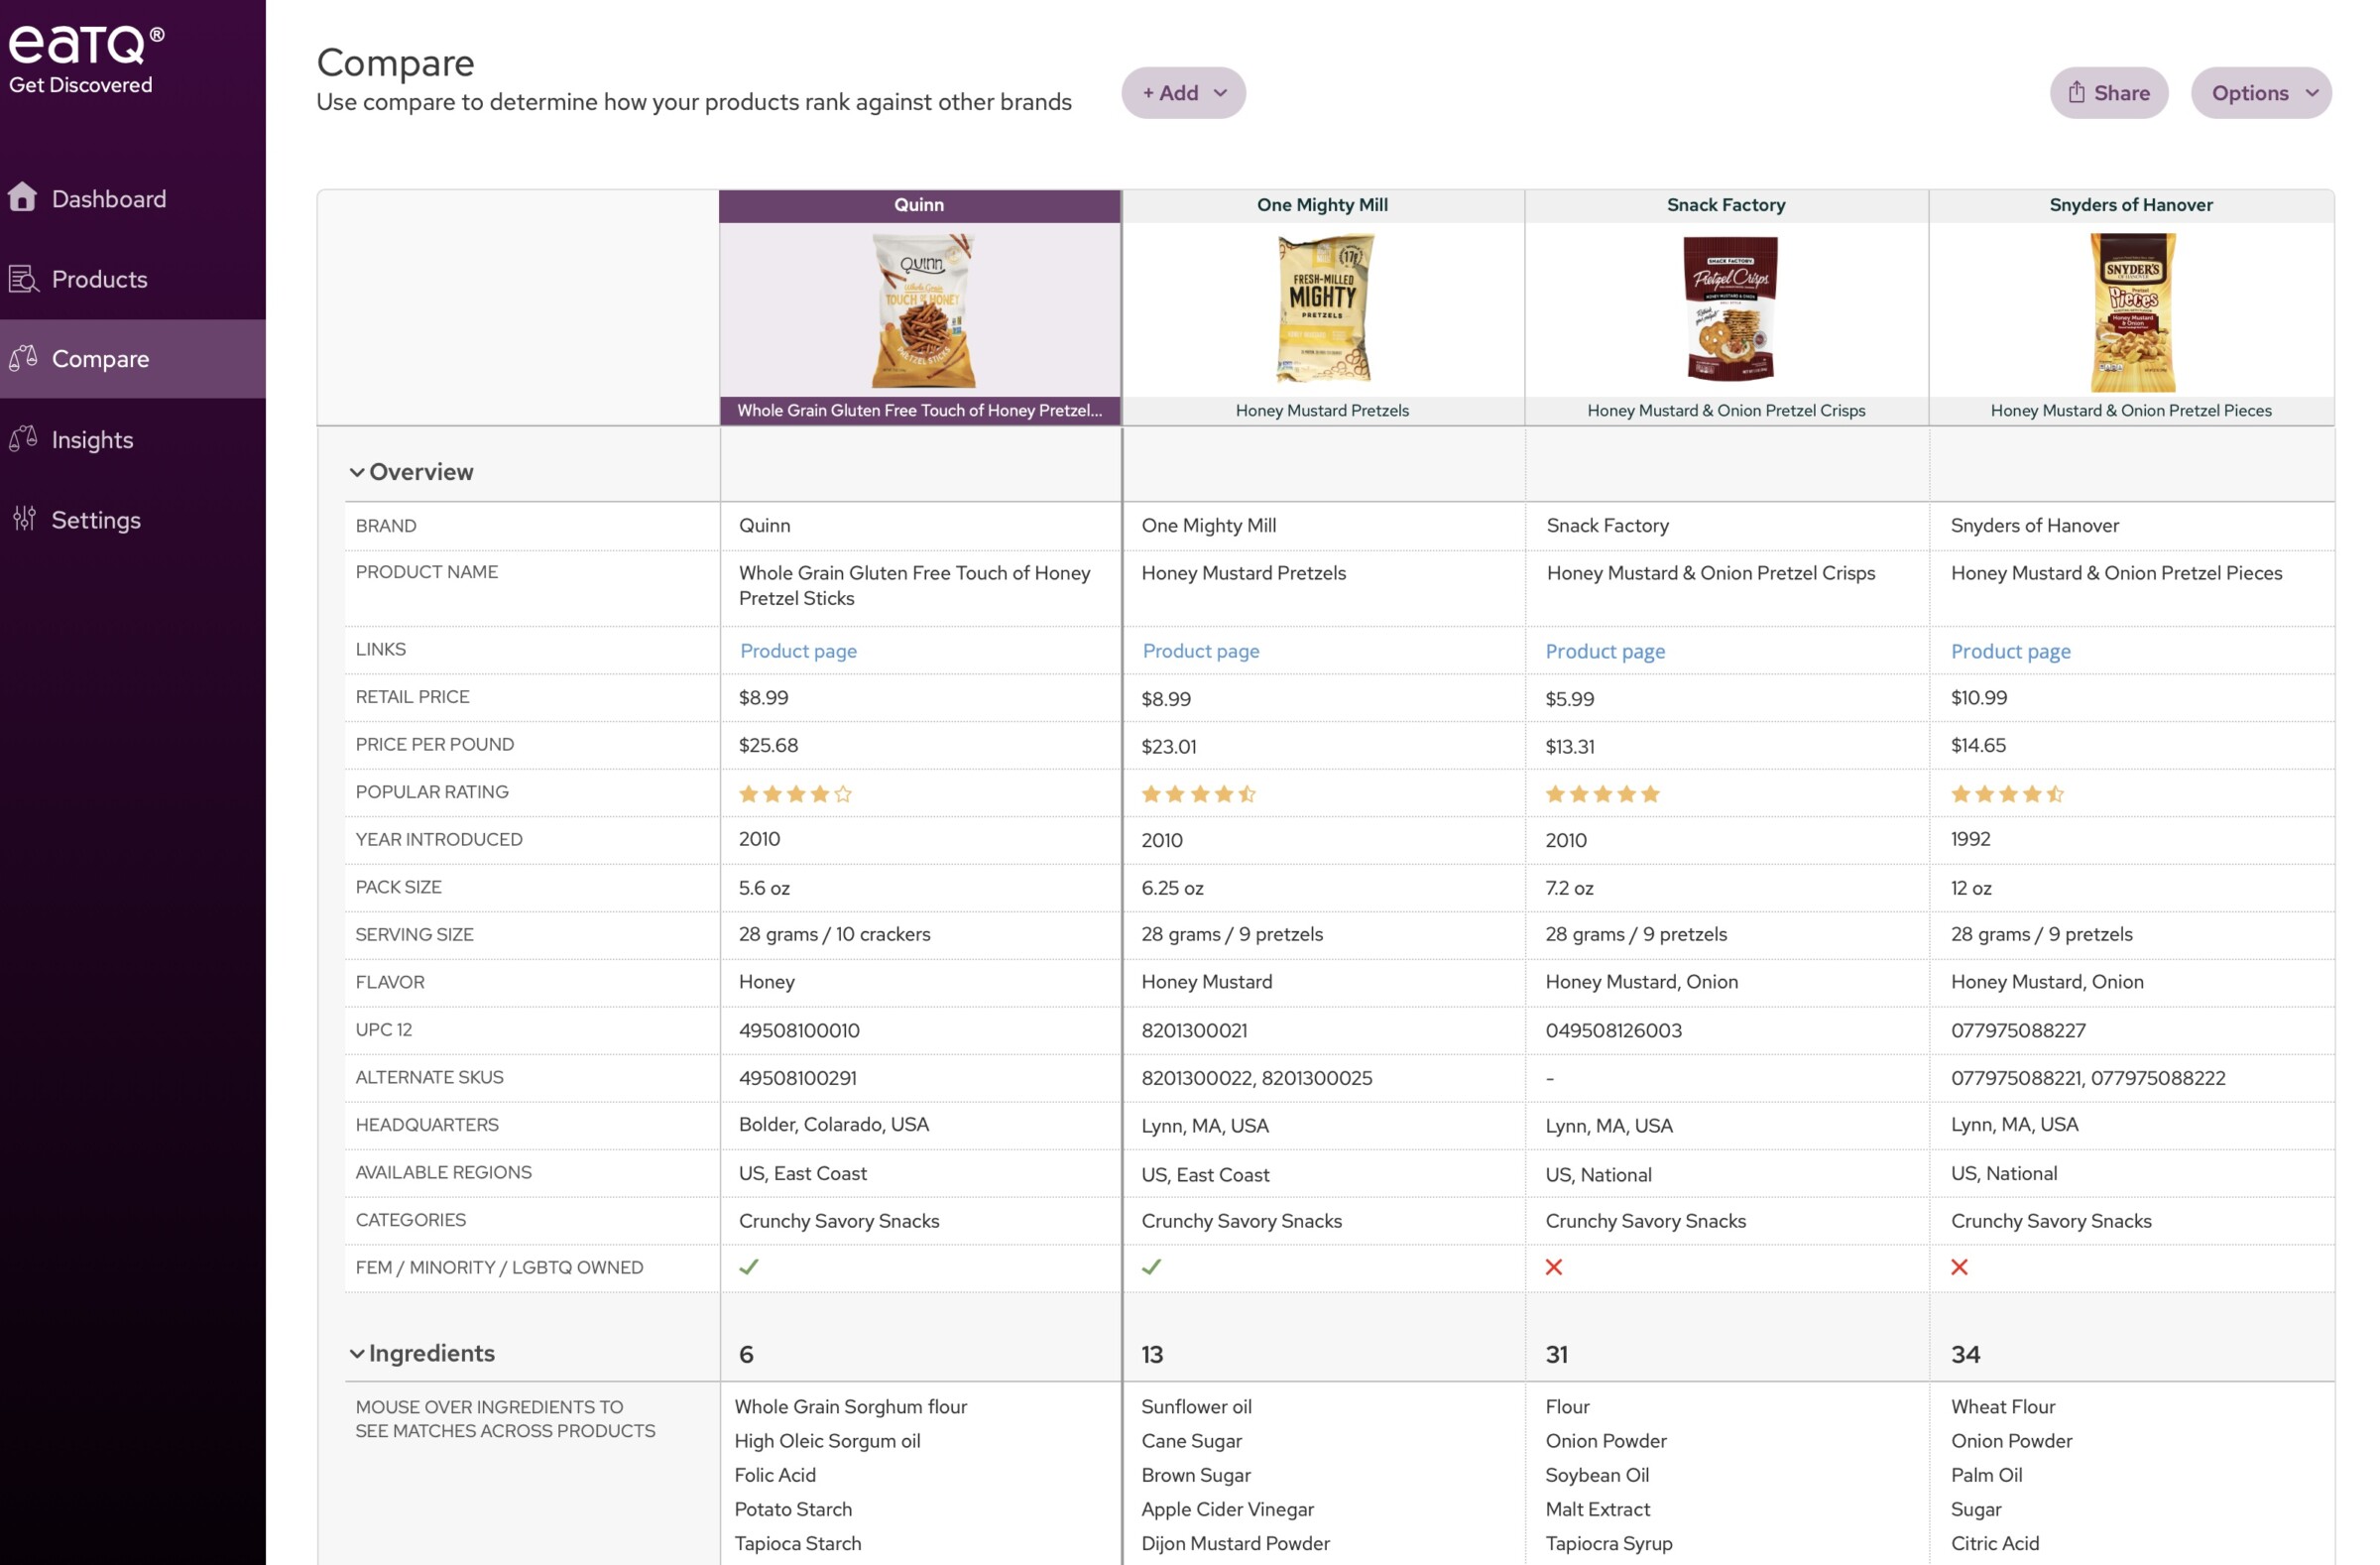
Compare Sheets
Compare Products on over 70 attributes.
Trust with independent data.
Extensive filtering on trending attributes.
Digitally share with retailers and partners.
Instant Search
Search by ingredients, attributes, brand name, description, nutrients, and more.
Over 70% of products are in the natural channel and 50% are emerging brands.
New products added weekly.

Who is this for?
Brand Owners and Product Developers: enhance brand positioning, guide product innovation, spot and seize Whitespace Opportunities
Investors: identify innovative brands and emerging market opportunities, particularly on ESG characteristics and uniqueness. Review the ESG scores for the brands in your portfolio.
Category Buyers and Foragers: identify brands with unique consumer-centric health and sustainability attributes, identify leaders in innovation, ESG, Health and Clean aspects, and identify common and unique attributes and trends in the landscape. Our platform also allows you to source innovative products that fulfill emerging consumer demands, and identify opportunities for you to grow your category sales.

